
Daily Readiness. Clearly Measured.
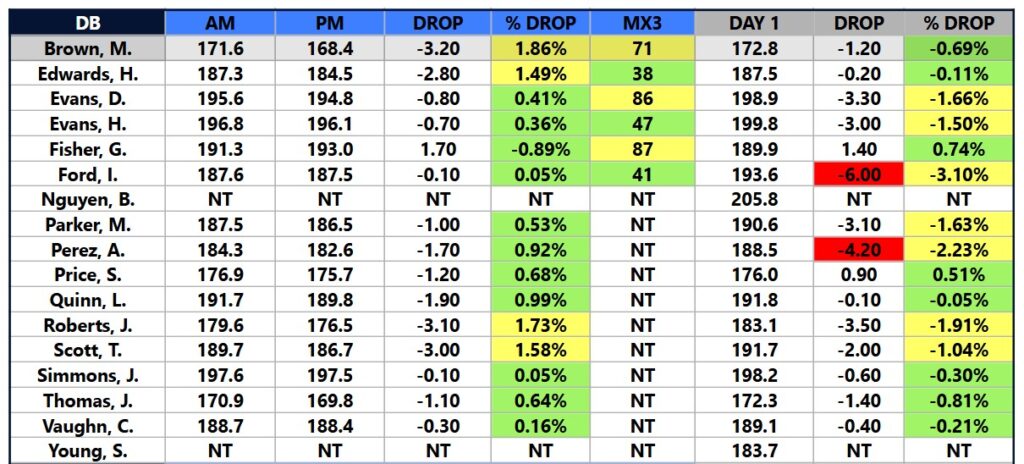
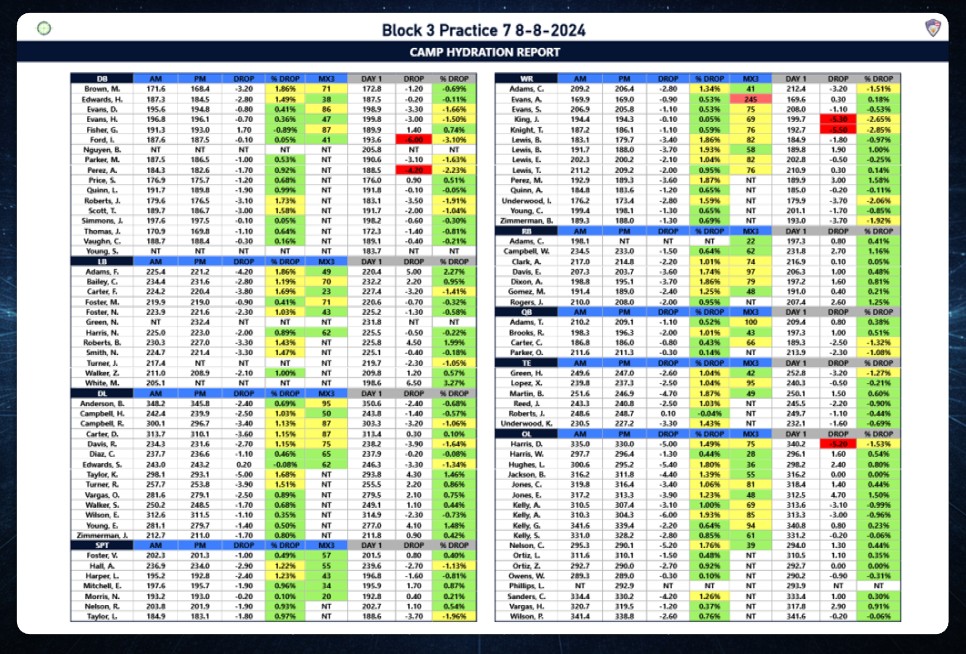
A live hydration report that brings AM body weight, PM body weight, and MX3 hydration scores into one clear view—automatically calculated, color-coded, and updated throughout the day.
Hydration data is only useful if it’s timely and easy to interpret. Too often, body weights live in spreadsheets, hydration scores live in another system, and staff are left doing manual math just to understand who’s at risk and who’s trending the right direction.
The Hydration Report eliminates that friction.
This report automatically calculates percent body weight drop and percent body weight change since day one, combining weight data with MX3 hydration scores to provide immediate context. All values are displayed using custom color thresholds defined by your program, so risk and readiness are instantly visible without interpretation.
The report refreshes every 30 minutes, can be filtered by date, and is available on any device—with the ability to export or share whenever needed.
Features & Advantages
| Feature | Real-World Impact |
|---|---|
| AM & PM body weight tracking | See daily hydration changes without manual comparison |
| MX3 hydration score integration | Combine objective hydration metrics with body weight data |
| Percent body weight drop | Instantly identify acute dehydration risk |
| Percent change since day one | Track longer-term hydration trends over time |
| Custom color thresholds | Flag risk levels based on your program’s standards |
| Auto-refresh every 30 minutes | Stay current throughout the day without manual updates |
| Date filtering & export | View any timeframe and share clean reports on demand |
| Multi-device access | Review hydration status on desktop, tablet, or phone |
Why It Matters — Especially During Camp
During camp periods, hydration becomes a daily—and sometimes hourly—decision. Sports scientists and nutritionists are often forced to pull data from multiple systems, run manual calculations in Excel, and rebuild the same views over and over just to answer a simple question: who is at risk right now?
This report eliminates that entirely.
All calculations live directly in Power BI, are updated automatically every 30 minutes, and are available on any device. There’s no compiling, no formulas to check, and no spreadsheets to manage.
You can answer who is at risk and who is not in under 60 seconds—anytime, anywhere—using a single, trusted view.
Built for Daily Operations
The Hydration Report is designed to live on screens, not in folders. It’s fast to read, easy to filter, and simple to share—so hydration becomes a consistent, proactive part of daily operations, especially when the margin for error is smallest.